Key Stage Results & Performance Tables
The DfE publish leaflets to help parents understand what to expect in reports from schools about pupils' assessments at the end of key stage 1 (KS1) and key stage 2 (KS2) . It describes the role of national curriculum tests and teacher assessments, as well as how results are used. To access the leaflets please click on the links below:
Key stage 1 and 2 national curriculum tests: information for parents - GOV.UK
Please find below the link to the latest performance tables for our school:
Lowerhouses CofE Primary School - Compare school and college performance data in England - GOV.UK
of
Zoom:
Search:
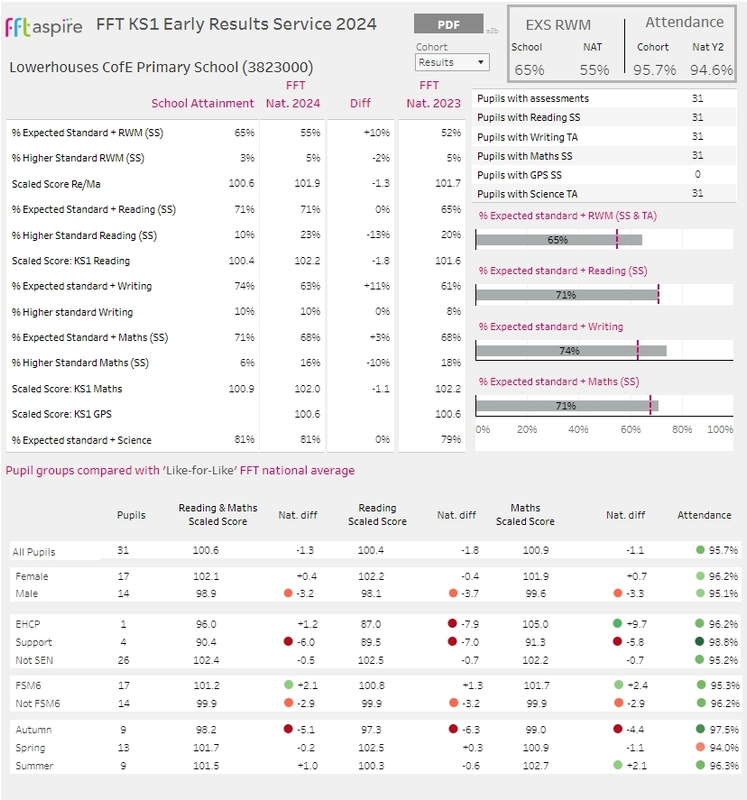
Key Stage 1 Results 2024-25
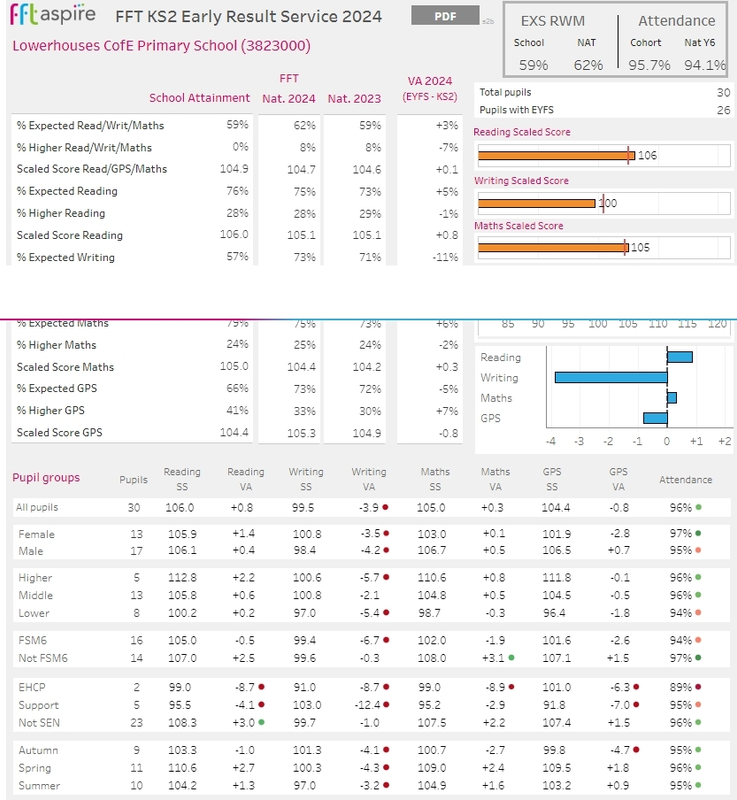
Key Stage 2 Results 2024-25